Housing and economic needs assessment
Guides councils in how to assess their housing needs.
This guidance was updated on 20 February 2019. See previous guidance
Housing need
What is housing need?
Housing need is an unconstrained assessment of the number of homes needed in an area. Assessing housing need is the first step in the process of deciding how many homes need to be planned for. It should be undertaken separately from assessing land availability, establishing a housing requirement figure and preparing policies to address this such as site allocations. For further details on how constraints should be considered once a housing need figure has been identified, please see Housing and economic land availability assessment guidance.
Paragraph: 001 Reference ID: 2a-001-20190220
Revision date: 20 02 2019
What is the standard method for assessing local housing need?
The National Planning Policy Framework expects strategic policy-making authorities to follow the standard method in this guidance for assessing local housing need.
The standard method uses a formula to identify the minimum number of homes expected to be planned for, in a way which addresses projected household growth and historic under-supply.
The standard method set out below identifies a minimum annual housing need figure. It does not produce a housing requirement figure.
Paragraph: 002 Reference ID: 2a-002-20190220
Revision date: 20 02 2019
Is the use of the standard method for strategic policy making purposes mandatory?
No, if it is felt that circumstances warrant an alternative approach but authorities can expect this to be scrutinised more closely at examination. There is an expectation that the standard method will be used and that any other method will be used only in exceptional circumstances.
Paragraph: 003 Reference ID: 2a-003-20190220
Revision date: 20 02 2019
How is a minimum annual local housing need figure calculated using the standard method?
The standard method can be used to calculate a minimum annual local housing need figure as follows:
Step 1 - Setting the baseline
Set the baseline using national household growth projections (2014-based household projections in England, table 406 unitary authorities and districts in England) for the area of the local authority. Using these projections, calculate the projected average annual household growth over a 10 year period (this should be 10 consecutive years, with the current year being used as the starting point from which to calculate growth over that period). Note that the figures displayed are rounded and individual cells need to be viewed in order to see the full number.
For information on re-organised authorities please see section below “How should local housing need be calculated for re-organised authorities?”
Step 2 - An adjustment to take account of affordability
Then adjust the average annual projected household growth figure (as calculated in step 1) based on the affordability of the area.
The most recent median workplace-based affordability ratios, published by the Office for National Statistics at a local authority level, should be used.
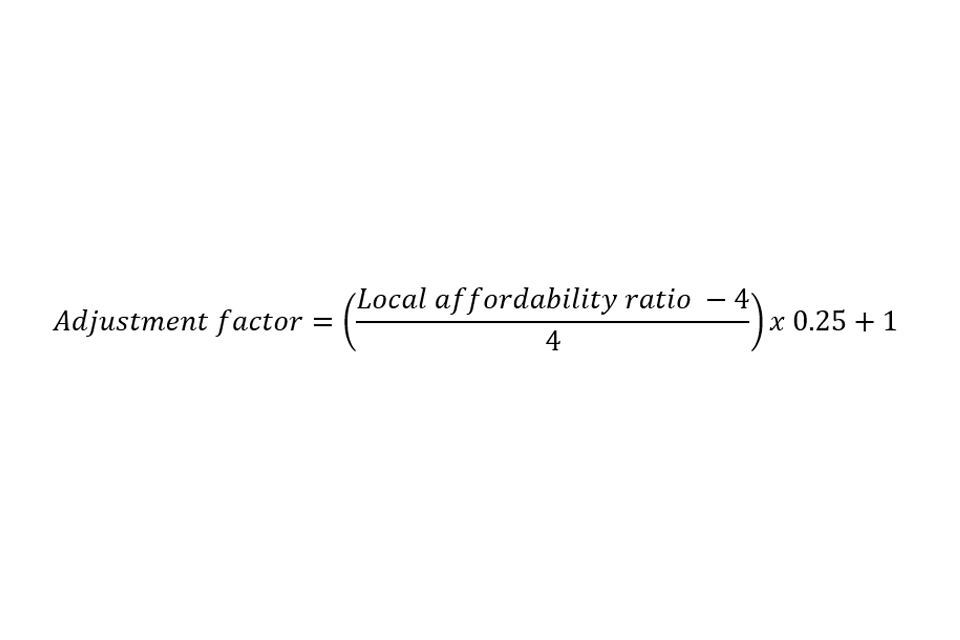
No adjustment is applied where the ratio is 4 or below. For each 1% the ratio is above 4, the average household growth baseline should be increased by a quarter of a percent. An authority with a ratio of 8 will have a 25% increase on its annual average household growth baseline.
Where an adjustment is to be made, the precise formula is as follows:
For information on re-organised authorities please see section below “How should local housing need be calculated for re-organised authorities?”
Step 3 - Capping the level of any increase
A cap is then applied which limits the increases an individual local authority can face. How this is calculated depends on the current status of relevant strategic policies for housing.
Where these policies were adopted within the last 5 years (at the point of making the calculation), the local housing need figure is capped at 40% above the average annual housing requirement figure set out in the existing policies.
This also applies where the relevant strategic policies have been reviewed by the authority within the 5 year period and found to not require updating.
Where the relevant strategic policies for housing were adopted more than 5 years ago (at the point of making the calculation), the local housing need figure is capped at 40% above whichever is the higher of:
a. the projected household growth for the area over the 10 year period identified in step 1; or
b. the average annual housing requirement figure set out in the most recently adopted strategic policies (if a figure exists).
For areas covered by spatial development strategies, the relevant strategic policies are those contained within the spatial development strategy. Where a requirement figure for an authority in a spatial development strategy differs from that in a local plan, the figure in the spatial development strategy should be used as long as the spatial development strategy is no older than 5 years.
Where the relevant strategic policies within a spatial development strategy are over 5 years old, the relevant strategic policies at individual local authority level set out in the authority’s local plan can be used in calculating the cap (if these policies are adopted after the relevant spatial development strategy, and the policies set out in the local plan are less than five years old, or older and has been found not to require updating as part of a plan review). If the relevant strategic housing requirement policies in the local authority’s local plan are over 5 years old, then the local housing need figure is capped at 40% above whichever is the higher of:
a. the projected household growth for the area over the 10 year period identified in step 1; or b. the most recent number taken from the spatial development strategy
For information on re-organised authorities please see section below “How should local housing need be calculated for re-organised authorities?”
Step 4 - cities and urban centres uplift
A 35% uplift is then applied for those urban local authorities in the top 20 cities and urban centres list.
Whether a cities and urban centres uplift applies depends on whether the local authority contains the largest proportion of population for one of the 20 cities or urban centres in England within the list.
The cities and urban centres list is devised by ranking the Office for National Statistics list of Major Towns and Cities by population size using the latest mid-year population estimates (nomis, official labour market statistics).
As at December 2020, this list of urban local authorities are: Birmingham, Bradford, Brighton and Hove, Bristol, Coventry, Derby, Kingston upon Hull, Leeds, Leicester, Liverpool, London, Manchester, Newcastle upon Tyne, Nottingham, Plymouth, Reading, Sheffield, Southampton, Stoke-on-Trent, and Wolverhampton.
To note: where a cap is applied in Step 3, the 35% uplift is applied after the cap.
Worked examples
Step 1 - Setting the baseline
An authority’s household projections are:
- 110,500 households in 2019
- 120,000 households in 2029
This is a total of 9,500 new households over the 10 year period, equivalent to an average household growth of 950 per year. (Note: in this example 2019 is the starting point to measure the growth over a 10 year period; the difference between 2019 and 2020 is one year’s worth of growth and the difference between 2019 and 2029 is 10 years’ worth of growth).
Step 2 - An adjustment to take account of affordability
The authority’s median workplace-based affordability ratio is 12.4. As this is above 4, then the following adjustment should be made.
The adjustment is calculated as:
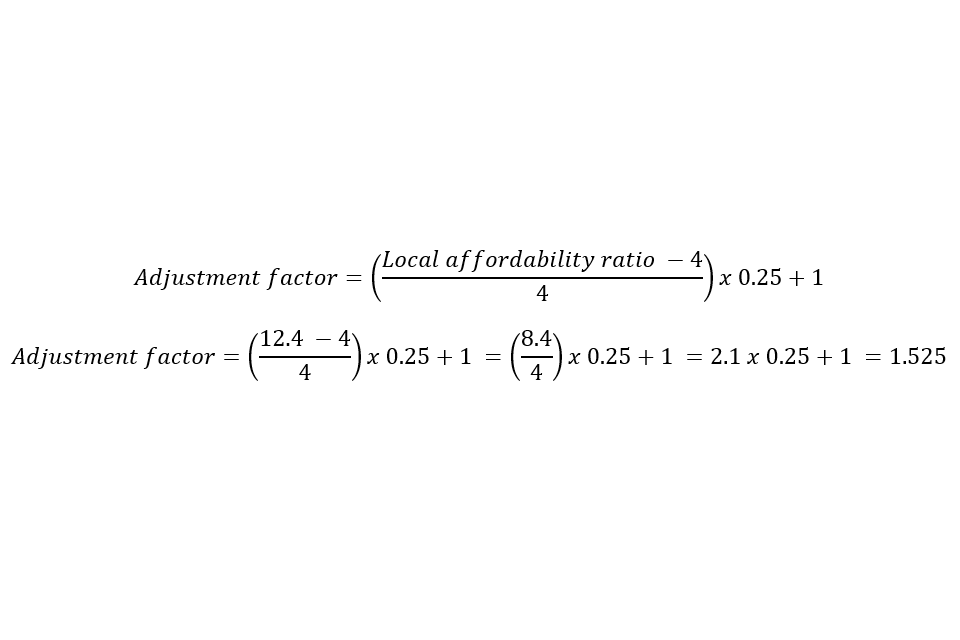
The adjustment factor is therefore 1.525 and is used as:
Minimum annual local housing need figure = (adjustment factor) x projected household growth
Minimum annual local housing need figure = 1.525 x 950
The resulting figure is 1,449.
Step 3 - Capping the level of any increase
How the cap applies depends on the current status of relevant strategic policies for housing. Below are 3 examples. Example 1 relates to a plan that has been adopted or reviewed within the last 5 years. Examples 2a and 2b relate to plans that were adopted more than 5 years ago and have not been updated, and demonstrates situations where the cap does and does not limit the minimum annual local housing need figure.
Cap example 1
The local authority has adopted a local plan within the last 5 years, or has reviewed (and if necessary updated) the housing requirement figure in a plan adopted more than 5 years ago.
- The average annual housing requirement figure in the existing relevant policies is 850 a year
- The minimum annual local housing need figure is 1,449 (as per step 2)
- The cap is set at 40% above the housing requirement figure:
Cap = 850 + (40% x 850) = 850 + 340 = 1,190
The capped figure is lower than the minimum annual local housing need figure and therefore limits the increase to the local authority’s minimum annual housing need figure. The minimum figure for this local authority is therefore 1,190.
Cap example 2a
A local authority adopted a local plan more than 5 years ago and has not reviewed their housing requirement figure since then.
- The average annual housing requirement figure in the existing relevant policies is 850 a year
- Average annual household growth over 10 years is 950 (as per step 1)
- The minimum annual local housing need figure is 1,449 (as per step 2)
- The cap is set at 40% above the higher of the most recent average annual housing requirement figure or household growth:
Cap = 950 + (40% x 950) = 950 + 380 = 1,330
The capped figure is lower than the minimum annual local housing need figure and therefore limits the increase to the local authority’s minimum annual housing need figure. The minimum figure for this local authority is therefore 1,330.
Cap example 2b
A local authority adopted a local plan more than 5 years ago and has not reviewed their housing requirement figure since then.
- The average annual housing requirement figure in the existing relevant policies is 1,200 a year
- Average annual household growth over 10 years is 950 (as per step 1)
- The minimum annual local housing need figure is 1,449 (as per step 2)
- The cap is set at 40% above the higher of the most recent average annual housing requirement figure or household growth:
Cap = 1,200 + (40% x 1,200) = 1,200 + 480 = 1,680
The capped figure is greater than the minimum annual local housing need figure and therefore does not limit the increase to the local authority’s minimum annual housing need figure. The minimum figure for this local authority is therefore 1,449.
Cities and urban centres uplift example
An urban local authority, where it is listed in Step 4, would uplift their figure generated by step 1-3 by 35%.
Paragraph: 004 Reference ID: 2a-004-20201216
Revision date: 16 12 2020 See previous version
Why are 2014-based household projections used as the baseline for the standard method?
The 2014-based household projections are used within the standard method to provide stability for planning authorities and communities, ensure that historic under-delivery and declining affordability are reflected, and to be consistent with the Government’s objective of significantly boosting the supply of homes.
Paragraph: 005 Reference ID: 2a-005-20190220
Revision date: 20 02 2019
Why is an affordability adjustment applied?
An affordability adjustment is applied as household growth on its own is insufficient as an indicator of future housing need because:
-
household formation is constrained to the supply of available properties – new households cannot form if there is nowhere for them to live; and
-
people may want to live in an area in which they do not reside currently, for example to be near to work, but be unable to find appropriate accommodation that they can afford.
The affordability adjustment is applied in order to ensure that the standard method for assessing local housing need responds to price signals and is consistent with the policy objective of significantly boosting the supply of homes. The specific adjustment in this guidance is set at a level to ensure that minimum annual housing need starts to address the affordability of homes.
Paragraph: 006 Reference ID: 2a-006-20190220
Revision date: 20 02 2019
Why is a cap applied?
The standard method may identify a minimum local housing need figure that is significantly higher than the number of homes currently being planned for. The cap is applied to help ensure that the minimum local housing need figure calculated using the standard method is as deliverable as possible.
The cap reduces the minimum number generated by the standard method, but does not reduce housing need itself. Therefore strategic policies adopted with a cap applied may require an early review and updating to ensure that any housing need above the capped level is planned for as soon as is reasonably possible.
Where the minimum annual local housing need figure is subject to a cap, consideration can still be given to whether a higher level of need could realistically be delivered. This may help prevent authorities from having to undertake an early review of the relevant policies.
Paragraph: 007 Reference ID: 2a-007-20190220
Revision date: 20 02 2019
Which cities and urban centres does the uplift apply to?
It should be noted that places can move in and out of the list of the top 20 local authorities in which a cities or urban centre uplift applies. To establish if an uplift applies, the Office for National Statistics list of Major Towns and Cities should be ranked in order of population size using the latest mid-year population estimates. If an authority is based in one of the top 20 most populated cities or urban centres and they contain the largest proportion of population in that city or urban centre, a 35% uplift is applied to that local authority area.
Paragraph: 033 Reference ID: 2a-033-20201216
Revision date: 16 12 2020
Is a cities and urban centres uplift applied in London and if so, how does it work?
Yes, an uplift applies in London. London is unique in that it has no single city centre which can carry need for the city area. Therefore a 35% uplift is applied to the entire SDS area (which covers all the London boroughs), rather than to the local authority which contains the largest proportion of London’s population. However, it should be noted that the responsibility for the overall distribution of housing need in London lies with the Mayor as opposed to individual boroughs so there is no policy assumption that this level of need will be met within the individual boroughs.
Paragraph: 034 Reference ID: 2a-034-20201216
Revision date: 16 12 2020
Where should the cities and urban centres uplift be met?
This increase in the number of homes to be delivered in urban areas is expected to be met by the cities and urban centres themselves, rather than the surrounding areas, unless it would conflict with national policy and legal obligations. In considering how need is met in the first instance, brownfield and other under-utilised urban sites should be prioritised and on these sites density should be optimised to promote the most efficient use of land. This is to ensure that homes are built in the right places, to make the most of existing infrastructure, and to allow people to live nearby the service they rely on, making travel patterns more sustainable.
Paragraph: 035 Reference ID: 2a-035-20201216
Revision date: 16 12 2020
Is there a transition period for plan-making for those authorities where the cities and urban centres uplift applies?
Yes, there is a transition period for plan-making for those authorities where the cities and urban centres uplift applies. These transitional arrangements give those authorities already at Regulation 19, (for Spatial Development Strategies this would refer to consultation under s335(2) of the Greater London Authority Act 1999) six months from the publication date of this guidance to submit (for spatial development strategies, ‘submission’ in this context means the point at which the Mayor sends to the Panel copies of all representations made in accordance with regulation 8(1) of the Town and Country Planning (London Spatial Development Strategy) Regulations 2000, or equivalent) their plans to the Planning Inspectorate under the existing standard method i.e. without the cities and urban centres uplift. In recognition that some areas will be very close to publishing their Regulation 19 plan (for Spatial Development Strategies this would refer to consultation under s335(2) of the Greater London Authority Act 1999), these areas will be given three months from the publication date of this revised guidance to publish their Regulation 19 plan for consultation, as well as a further six months from the date they publish their Regulation 19 plan to submit their plan to the Planning Inspectorate, to benefit from the transition period.
Paragraph: 036 Reference ID: 2a-036-20201216
Revision date: 16 12 2020
Is there a transition period for decision-making for those authorities where the cities and urban centres uplift applies?
Yes, there is a transition period for decision-making for those authorities where the cities and urban centres uplift applies. Transitional arrangements will apply for six months from the publication date of this guidance. This means that the local housing need calculation excluding cities and urban centres uplift, can be used, for example when determining the housing requirement for the 5 year housing land supply, until this date. After this date, the new standard method (i.e. with cities and urban centres uplift) will apply for relevant decision-making purposes.
Paragraph: 037 Reference ID: 2a-037-20201216
Revision date: 16 12 2020
How does the cities and urban centres uplift apply for Housing Delivery Test?
For the purposes of Housing Delivery Test, the cities and urban centres uplift within the standard method will only apply from the 2022/23 monitoring year, (from the 2023 Housing Delivery Test measurement).
Paragraph: 038 Reference ID: 2a-038-20201216
Revision date: 16 12 2020
When should strategic policy-making authorities assess their housing need figure for policy-making purposes?
Strategic policy-making authorities will need to calculate their local housing need figure at the start of the plan-making process. This number should be kept under review and revised where appropriate.
The housing need figure generated using the standard method may change as the inputs are variable and this should be taken into consideration by strategic policy-making authorities.
However, local housing need calculated using the standard method may be relied upon for a period of 2 years from the time that a plan is submitted to the Planning Inspectorate for examination.
Paragraph: 008 Reference ID: 2a-008-20190220
Revision date: 20 02 2019
How often are the affordability ratios updated?
Affordability ratios are published every year (usually in March).
Paragraph: 009 Reference ID: 2a-009-20190220
Revision date: 20 02 2019
When might it be appropriate to plan for a higher housing need figure than the standard method indicates?
The government is committed to ensuring that more homes are built and supports ambitious authorities who want to plan for growth. The standard method for assessing local housing need provides a minimum starting point in determining the number of homes needed in an area. It does not attempt to predict the impact that future government policies, changing economic circumstances or other factors might have on demographic behaviour. Therefore, there will be circumstances where it is appropriate to consider whether actual housing need is higher than the standard method indicates.
This will need to be assessed prior to, and separate from, considering how much of the overall need can be accommodated (and then translated into a housing requirement figure for the strategic policies in the plan). Circumstances where this may be appropriate include, but are not limited to situations where increases in housing need are likely to exceed past trends because of:
-
growth strategies for the area that are likely to be deliverable, for example where funding is in place to promote and facilitate additional growth (e.g. Housing Deals);
-
strategic infrastructure improvements that are likely to drive an increase in the homes needed locally; or
-
an authority agreeing to take on unmet need from neighbouring authorities, as set out in a statement of common ground;
There may, occasionally, also be situations where previous levels of housing delivery in an area, or previous assessments of need (such as a recently-produced Strategic Housing Market Assessment) are significantly greater than the outcome from the standard method. Authorities are encouraged to make as much use as possible of previously-developed or brownfield land, and therefore cities and urban centres, not only those subject to the cities and urban centres uplift may strive to plan for more home. Authorities will need to take this into account when considering whether it is appropriate to plan for a higher level of need than the standard model suggests.
Paragraph: 010 Reference ID: 2a-010-20201216
Revision date: 16 12 2020 See previous version
Can strategic policy-making authorities take account of past under delivery of new homes in preparing plans?
The affordability adjustment is applied to take account of past under-delivery. The standard method identifies the minimum uplift that will be required and therefore it is not a requirement to specifically address under-delivery separately.
Where an alternative approach to the standard method is used, past under delivery should be taken into account.
Paragraph: 011 Reference ID: 2a-011-20190220
Revision date: 20 02 2019
How can plan-making authorities apply the method to the overall plan period?
The method provides authorities with an annual number, based on a 10 year base line, which can be applied to the whole plan period.
The National Planning Policy Framework requires strategic policies to look ahead over a minimum 15 year period from adoption, although authorities are required to keep their policies under review.
Paragraph: 012 Reference ID: 2a-012-20190220
Revision date: 20 02 2019
How should local housing need be calculated where plans cover more than one area?
Local housing need assessments may cover more than one area, in particular where strategic policies are being produced jointly, or where spatial development strategies are prepared by elected Mayors, or combined authorities with strategic policy-making powers.
In such cases the housing need for the defined area should at least be the sum of the local housing need for each local planning authority within the area. It will be for the relevant strategic policy-making authority to distribute the total housing requirement which is then arrived at across the plan area.
If a cities and urban centres uplift applies to a local authority which is part of a joint plan, this is calculated by separately working out the local housing need for each authority. The urban authority containing the city or urban centre will then have its need identified in Step 3 uplifted in Step 4. The cap would be calculated according to each individual authority’s circumstances and where a joint plan has been not been separate, the joint plan authority should make efforts to decide how much of the housing requirement will remain in each local authority. These figures can then be summed again to provide an overall figure for a joint plan.
It will be for the relevant strategic policy-making authority to distribute the total housing requirement which is then arrived at across the plan area.
Where a spatial development strategy has been published, local planning authorities should use the local housing need figure in the spatial development strategy and should not seek to re-visit their local housing need figure when preparing new strategic or non-strategic policies.
Paragraph: 013 Reference ID: 2a-013-20201216
Revision date: 15 12 2020 See previous version
Where strategic policy-making authority boundaries do not align with local authority boundaries, or data is not available, should the standard method be used to assess local housing need?
Where strategic policy-making authorities do not align with local authority boundaries (either individually or in combination), or the data required for the model are not available such as in National Parks and the Broads Authority, where local authority boundaries have changed due to reorganisation within the last 5 years or local authority areas where the samples are too small, an alternative approach will have to be used. Such authorities may continue to identify a housing need figure using a method determined locally, but in doing so will need to consider the best available information on anticipated changes in households as well as local affordability levels.
Paragraph: 014 Reference ID: 2a-014-20190220
Revision date: 20 02 2019
How should local housing need be calculated for re-organised authorities?
Planning policies adopted by predecessor authorities will remain part of the development plan for their area upon reorganisation, until they are replaced by adopted successor authority policies or until the fifth anniversary of reorganisation.
In the interim, authorities are reliant on strategic housing requirement policies set out in the development plans of the predecessor local authorities when decision-making, such as when determining the housing requirement for their 5-year housing land supply. More detail on how to demonstrate their 5 year housing land supply is contained in the Housing and Delivery Guidance.
Sourcing data inputs for re-organised authorities is dependent on the geographies at which these data inputs are published. Where local authorities have recently re-organised, to form a new unitary or single-tier authority:
- As 2014 Household Projections are used in Step 1 of the standard method, these will not be available for the new/merged authorities – so local housing need in decision-making and plan-making, should be calculated at the predecessor local authority level for steps 1 to 3 (and 4 if appropriate);
- If the latest affordability ratios are available at predecessor local authority level, these should be used for the affordability adjustment (Step 2). Where the latest published ratios are not available at these geographies, the latest available affordability ratio at that predecessor level should be used.
- The cap (Step 3) should also be applied at the predecessor authority level with each predecessor area will have their cap applied based on the status of the predecessor authorities’ strategic housing requirements. This will mean the cap is set against either local plan, or household growth as appropriate.
For plan-making, the new/re-organised local authority should use a local housing need for the new/merged authority area, which is at least is the sum of the local housing need of all the predecessor local authorities. Once a re-organised authority has adopted strategic housing policies covering the whole of its area, this will be used to determine the housing requirement, and the cap should then be applied on these policies.
Paragraph: 039 Reference ID: 2a-039-20201216
Revision date: 16 12 2020
If authorities use a different method how will this be tested at examination?
Where data availability does not allow the standard method to be used, consideration will be given to whether it provides the basis for a plan that is positively prepared, taking into account the information available on household formation and affordability.
Where a strategic policy-making authority can show that an alternative approach identifies a need higher than using the standard method, and that it adequately reflects current and future demographic trends and market signals, the approach can be considered sound as it will have exceeded the minimum starting point.
Where an alternative approach results in a lower housing need figure than that identified using the standard method, the strategic policy-making authority will need to demonstrate, using robust evidence, that the figure is based on realistic assumptions of demographic growth and that there are exceptional local circumstances that justify deviating from the standard method. This will be tested at examination.
Any method which relies on using household projections more recently published than the 2014-based household projections will not be considered to be following the standard method as set out in paragraph 60 of the National Planning Policy Framework. As explained above, it is not considered that these projections provide an appropriate basis for use in the standard method.
Paragraph: 015 Reference ID: 2a-015-20190220
Revision date: 20 02 2019
How is housing need calculated for the purposes of decision making?
There is separate guidance on how the standard method for assessing local housing need applies to calculating 5 Year Land Supply and the Housing Delivery Test.
Paragraph: 016 Reference ID: 2a-016-20190220
Revision date: 20 02 2019
Identifying the need for different types of housing
There is separate guidance on identifying the housing needs of different groups and housing needs of older and disabled people.
Paragraph: 017 Reference ID: 2a-017-20190722
Revision date: 22 07 2019 See previous version
Affordable housing
What types of households are considered to be in affordable housing need?
All households whose needs are not met by the market can be considered in affordable housing need. The definition of affordable housing for planning purposes is set out in Annex 2 of the National Planning Policy Framework.
Paragraph: 018 Reference ID: 2a-018-20190220
How can affordable housing need be calculated?
Strategic policy-making authorities will need to estimate the current number of households and projected number of households who lack their own housing or who cannot afford to meet their housing needs in the market. This should involve working with colleagues in their relevant authority (e.g. housing, health and social care departments).
Paragraph: 019 Reference ID: 2a-019-20190220
Revision date: 20 02 2019
How can the current unmet gross need for affordable housing be calculated?
Strategic policy-making authorities can establish the unmet (gross) need for affordable housing by assessing past trends and current estimates of:
- the number of homeless households;
- the number of those in priority need who are currently housed in temporary accommodation;
- the number of households in over-crowded housing;
- the number of concealed households;
- the number of existing affordable housing tenants in need (i.e. householders currently housed in unsuitable dwellings); and
- the number of households from other tenures in need and those that cannot afford their own homes, either to rent, or to own, where that is their aspiration.
Care should be taken to avoid double-counting, which may be brought about with the same households being identified on more than one transfer list, and to include only those households who cannot afford to access suitable housing in the market.
Suggested data sources: Local authorities will hold data on the number of homeless households, those in temporary accommodation and extent of overcrowding. The Census also provides data on concealed households and overcrowding which can be compared with trends contained in the English Housing Survey. Housing registers and local authority and registered social landlord transfer lists will also provide relevant information.
Paragraph: 020 Reference ID: 2a-020-20190220
Revision date: 20 02 2019
How can the number of newly arising households likely to be in affordable housing need be calculated (gross annual estimate)?
Projections of affordable housing need will have to reflect new household formation, the proportion of newly forming households unable to buy or rent in the market area, and an estimate of the number of existing households falling into need. This process will need to identify the minimum household income required to access lower quartile (entry level) market housing (strategic policy-making authorities can use current costs in this process, but may wish to factor in anticipated changes in house prices and wages). It can then assess what proportion of newly-forming households will be unable to access market housing.
Suggested data sources: Ministry of Housing, Communities and Local Government household projections, English Housing Survey, local authority and registered social landlords databases, and mortgage lenders.
Total newly arising affordable housing need (gross per year) = (the number of newly forming households x the proportion unable to afford market housing) + existing households falling into need
Paragraph: 021 Reference ID: 2a-021-20190220
Revision date: 20 02 2019
How can the current total affordable housing supply available be calculated?
There will be a current supply of housing stock that can be used to accommodate households in affordable housing need as well as future supply. Assessing the total affordable housing supply requires identifying:
- the number of affordable dwellings that are going to be vacated by current occupiers that are fit for use by other households in need;
- suitable surplus stock (vacant properties); and
- the committed supply of new net affordable homes at the point of the assessment (number and size).
Sources of data: Ministry of Housing, Communities and Local Government affordable housing supply statistics to show recent trends, and local authority and Registered Social Landlord records including housing register, transfer lists, demolition and conversion programmes, development programme of affordable housing providers.
Total affordable housing stock available = Dwellings currently occupied by households in need + surplus stock + committed additional housing stock – units to be taken out of management
Paragraph: 022 Reference ID: 2a-022-20190220
Revision date: 13 09 2018
What is the relationship between the current housing stock and current and future needs?
Strategic policy-making authorities will need to look at the current stock of houses of different sizes and assess whether these match current and future needs.
Paragraph: 023 Reference ID: 2a-023-20190220
Revision date: 20 02 2019
How is the total annual need for affordable housing calculated?
The total need for affordable housing will need to be converted into annual flows by calculating the total net need (subtract total available stock from total gross need) and converting total net need into an annual flow based on the plan period.
The total affordable housing need can then be considered in the context of its likely delivery as a proportion of mixed market and affordable housing developments, taking into account the probable percentage of affordable housing to be delivered by eligible market housing led developments. An increase in the total housing figures included in the plan may need to be considered where it could help deliver the required number of affordable homes.
Paragraph: 024 Reference ID: 2a-024-20190220
Revision date: 20 02 2019
Economic need
How can authorities determine the type of employment land that is needed?
Strategic policy-making authorities will need to prepare a robust evidence base to understand existing business needs, which will need to be kept under review to reflect local circumstances and market conditions. National economic trends may not automatically translate to particular areas with a distinct employment base. Where appropriate, local planning authorities can use their Authority Monitoring Report and the plan review process to ensure that their evidence base remains up to date.
Functional economic market areas can overlap several administrative areas so strategic policy-making authorities may have to carry out assessments of need on a cross-boundary basis with neighbouring authorities within their functional economic market area. Local Enterprise Partnerships (and county councils) can play a key role in this process.
Paragraph: 025 Reference ID: 2a-025-20190220
Revision date: 20 02 2019
How can strategic policy making authorities prepare and maintain evidence about business needs?
In gathering evidence to plan for business uses, strategic policy making authorities will need to liaise closely with the business community, taking account of the Local Industrial Strategy, to understand their current and potential future requirements. They will need to assess:
- the best fit functional economic market area
- the existing stock of land for employment uses within the area;
- the recent pattern of employment land supply and loss – for example based on extant planning permissions and planning applications (or losses to permitted development);
- evidence of market demand (including the locational and premises requirements of particular types of business) – sourced from local data and market intelligence, such as recent surveys of business needs, discussions with developers and property agents and engagement with business and economic forums;
- wider market signals relating to economic growth, diversification and innovation; and
- any evidence of market failure – such as physical or ownership constraints that prevent the employment site being used effectively.
Paragraph: 026 Reference ID: 2a-026-20190220
Revision date: 20 02 2019
How can market signals be used to forecast future need?
Strategic policy making authorities will need to develop an idea of future needs based on a range of data which is current and robust, such as:
- sectoral and employment forecasts and projections which take account of likely changes in skills needed (labour demand)
- demographically derived assessments of current and future local labour supply (labour supply techniques)
- analysis based on the past take-up of employment land and property and/or future property market requirements
- consultation with relevant organisations, studies of business trends, an understanding of innovative and changing business models, particularly those which make use of online platforms to respond to consumer demand and monitoring of business, economic and employment statistics.
Authorities will need to take account of longer term economic cycles in assessing this data, and consider and plan for the implications of alternative economic scenarios.
Paragraph: 027 Reference ID: 2a-027-20190220
Revision date: 20 02 2019
How can strategic policy making authorities identify the existing stock of employment land and identify the recent pattern of supply and loss?
A simple typology of employment land by market segment and by sub-areas, where there are distinct property market areas within authorities, can be developed and analysed. This can be supplemented by information on permissions for other uses that have been granted, if available, on sites formerly in employment use.
Paragraph: 028 Reference ID: 2a-028-20190220
Revision date: 20 02 2019
How can current market demand be analysed?
The available stock of land can be compared with the particular requirements of the area so that ‘gaps’ and any over-supply in local employment land provision can be identified.
It is important to consider recent employment land take-up and projections (based on past trends) and forecasts (based on future scenarios), and to identify instances where sites have been developed or sought for specialist economic uses. This will help to provide an understanding of the underlying requirements for office, general business and distribution space, and (when compared with the overall stock of employment sites) can form the context for appraising individual sites.
Analysing supply and demand will allow policy makers to identify whether there is a mismatch between quantitative and qualitative supply of and demand for employment sites. This will enable an understanding of which market segments are over-supplied to be derived and those which are undersupplied.
Paragraph: 029 Reference ID: 2a-02920190220
Revision date: 20 02 2019
How can employment land requirements be derived?
When translating employment and output forecasts into land requirements, there are 4 key relationships which need to be quantified. This information can be used to inform the assessment of land requirements:
- Standard Industrial Classification sectors to use classes
- Standard Industrial Classification sectors to type of property
- employment to floorspace (employment density) and
- floorspace to site area (plot ratios based on industry proxies)
Paragraph: 030 Reference ID: 2a-030-20190220
Revision date: 20 02 2019
How can authorities assess need and allocate space for logistics?
The logistics industry plays a critical role in enabling an efficient, sustainable and effective supply of goods for consumers and businesses, as well as contributing to local employment opportunities, and has distinct locational requirements that need to be considered in formulating planning policies (separately from those relating to general industrial land).
Strategic facilities serving national or regional markets are likely to require significant amounts of land, good access to strategic transport networks, sufficient power capacity and access to appropriately skilled local labour. Where a need for such facilities may exist, strategic policy-making authorities should collaborate with other authorities, infrastructure providers and other interests to identify the scale of need across the relevant market areas. This can be informed by:
- engagement with logistics developers and occupiers to understand the changing nature of requirements in terms of the type, size and location of facilities, including the impact of new and emerging technologies;
- analysis of market signals, including trends in take up and the availability of logistics land and floorspace across the relevant market geographies;
- analysis of economic forecasts to identify potential changes in demand and anticipated growth in sectors likely to occupy logistics facilities, or which require support from the sector; and
- engagement with Local Enterprise Partnerships and review of their plans and strategies, including economic priorities within Local Industrial Strategies.
Strategic policy-making authorities will then need to consider the most appropriate locations for meeting these identified needs (whether through the expansion of existing sites or development of new ones).
Authorities will also need to assess the extent to which land and policy support is required for other forms of logistics requirements, including the needs of SMEs and of ‘last mile’ facilities serving local markets. A range of up-to-date evidence may have to be considered in establishing the appropriate amount, type and location of provision, including market signals, anticipated changes in the local population and the housing stock as well as the local business base and infrastructure availability.
Paragraph: 031 Reference ID: 2a-031-20190722
Revision date: 22 07 2019
How can the specific locational requirements of specialist or new sectors be addressed?
When assessing what land and policy support may be needed for different employment uses, it will be important to understand whether there are specific requirements in the local market which affect the types of land or premises needed. Clustering of certain industries (such as some high tech, engineering, digital, creative and logistics activities) can play an important role in supporting collaboration, innovation, productivity, and sustainability, as well as in driving the economic prospects of the areas in which they locate. Strategic policy-making authorities will need to develop a clear understanding of such needs and how they might be addressed taking account of relevant evidence and policy within Local Industrial Strategies. For example, this might include the need for greater studio capacity, co-working spaces or research facilities.
These needs are often more qualitative in nature and will have to be informed by engagement with businesses and occupiers within relevant sectors.
Paragraph: 032 Reference ID: 2a-032-20190722
Revision date: 22 07 2019
Last updated 16 December 2020 + show all updates
-
Added new paragraphs: 033 to 039 Amended paragraphs: 004, 010 and 013
-
Added new paragraphs - 031 and 032
-
New version of guidance February 2019
-
Amended paragraphs 001, 004 to 018, 020 and new paragraphs 028-034
-
New version of guidance to reflect the revised version of the National Planning Policy Framework 2018.
-
Updated guidance.
-
First published.